Think you know which car color cops target most? The answer isn’t what most people expect. The “arrest-me red” myth has been floating around for decades, but real traffic data tells a completely different story. Stick around — we’re breaking down exactly what color cars get pulled over the most, and the truth is way more interesting than the myth.
The Short Answer: White Cars Top the List
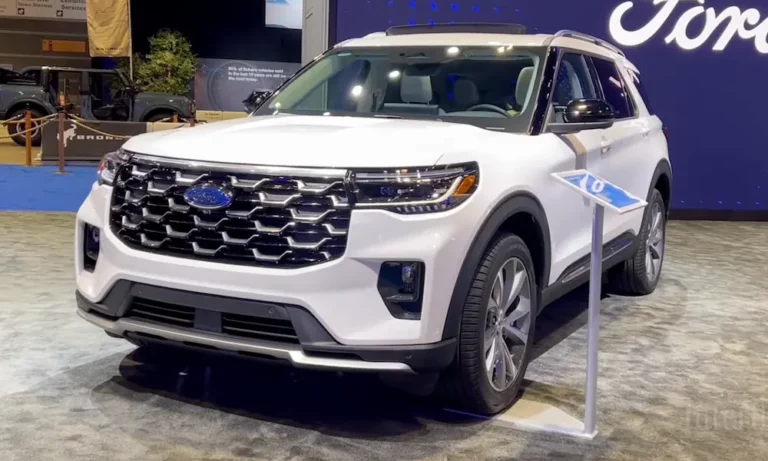
If you’re wondering what color cars get pulled over the most by sheer numbers, it’s white.
A study analyzing 924 speeding citations found that white vehicles accounted for 19% of all traffic tickets — the single largest share. Red came in second at 16%, followed by gray and silver.
But here’s the catch: that raw number is deeply misleading without context.
Why White Cars Dominate Ticket Data (It’s Not What You Think)
White isn’t getting pulled over because cops hate it. It’s getting pulled over because it’s everywhere.
White has been the most popular car color in North America for nearly a decade straight. It covers rental fleets, delivery vans, commercial trucks, and millions of personal vehicles. White represents roughly 25–31% of all cars on the road.
When a color makes up nearly a third of all traffic, of course it’s going to show up most in ticket data. This is called population bias — and it completely skews public perception about which car colors actually attract police.
Think of it like this: if 30% of cars on the highway are white, you’d expect 30% of tickets to go to white cars just by chance. But white only accounts for 19% of citations. That means white cars are actually underrepresented in traffic stops relative to how many are on the road.
The Real Color That Gets Disproportionately Ticketed
When you adjust for market share, red cars stand out in a genuinely notable way.
Red makes up just 5–8% of vehicles on U.S. roads today — but it accounts for 16% of speeding citations. That’s a significant gap. Gray cars show a similar pattern, and their overrepresentation has grown alongside their surge in popularity.
Here’s how the numbers break down:
| Car Color | Estimated U.S. Market Share | Share of Traffic Citations | Proportional Risk |
|---|---|---|---|
| White | 25–31% | ~19% | Underrepresented |
| Black | 19–23% | ~11% | Roughly proportional |
| Gray | 16–22% | ~10% | Slightly over |
| Silver | 7–14% | ~8% | Roughly proportional |
| Red | 5–8% | ~16% | Significantly over |
| Blue | 6–10% | ~7% | Roughly proportional |
So yes — red cars do get disproportionately more tickets relative to how many exist. But the reason why has nothing to do with the color itself.
Why Red Cars Actually Attract More Attention
The Vividness Effect Is Real
The human brain is wired to notice contrast. Against gray asphalt and a sea of silver and white cars, a bright red vehicle is a visual magnet.
Law enforcement officers scan for deviations from the norm. A red sports car cutting through traffic simply stands out more than a beige sedan doing the same thing. This psychological phenomenon is called the vividness effect — and it’s not a conscious bias. It’s just how human vision works in complex environments.
Red’s Cultural Baggage
Red has centuries of psychological weight behind it. It signals danger, urgency, and speed. The United States didn’t officially adopt red as the stop sign standard until 1954, but since then, red has become inseparable from traffic enforcement — brake lights, fire trucks, emergency sirens.
When an officer sees a red sports car accelerating hard in traffic, there may be an unconscious association at play. Nobody’s consciously targeting red paint. But the color communicates a certain energy that draws a second look.
The Vehicle Type Problem
Here’s the real kicker: red gets slapped on performance cars way more than any other type of vehicle.
Ford Mustangs, Subaru WRXs, Volkswagen GTIs, and Dodge Challengers all come in bold, vibrant reds as standard options. These cars are built for speed. They rev loud, accelerate fast, and attract attention even before color enters the equation.
The most ticketed vehicles in America include models like the Subaru WRX, Scion FR-S, and Mercedes-Benz SL-Class — all performance-oriented cars that come in bright colors. Contrast that with the Buick Encore or Chevrolet Suburban, which are up to 90% less likely to receive a ticket. Nobody’s painting a Buick Encore rally red.
It’s the Driver, Not the Color
Insurance editors and law enforcement officials repeat this constantly: cars don’t get tickets. Drivers do.
The data backs this up. Male drivers get stopped about 30% more often than female drivers. Drivers under 25 receive the highest volume of citations overall. This same demographic is also heavily drawn to sporty, attention-grabbing vehicles in bold colors.
Twenty percent of new car purchases by buyers aged 18–34 are red. Men show a 12.3% higher preference for red vehicles than women. The personality traits that lead someone to buy a loud red sports car — thrill-seeking, extroversion, risk tolerance — are the same traits that predict aggressive driving behavior.
The color is just a side effect of the driver profile.
Do Modern Traffic Systems Even See Color?
Not really. Modern traffic enforcement is increasingly automated, and radar guns, LIDAR systems, speed cameras, and license plate readers don’t register paint color. They measure velocity or capture a license plate. A speed camera doesn’t know if the car doing 78 in a 55 is red or gray.
The top five reasons police actually initiate a traffic stop are:
- Speeding — the number one trigger
- Distracted driving — phone use especially
- Hazardous maneuvers — illegal U-turns, running stop signs
- Equipment violations — broken taillights, dark window tint
- Tailgating and unsafe lane changes
None of those involve paint color. As automated enforcement expands, the human visual element shrinks further.
What Color Car Is Safest From a Risk Perspective?
While we’re on the subject of color and roads, your car’s color does affect something important: crash risk.
White is the safest car color, with up to 12% lower accident risk than darker vehicles. It’s visible in almost all conditions except heavy snow. Yellow and orange share similar safety profiles — which is exactly why school buses and service vehicles use them.
Black cars? They carry a 10–47% higher collision risk compared to white, especially at dusk and in bad weather.
Red sits in an awkward middle ground. It’s vibrant in theory, but our roads are already saturated with red signals — brake lights, traffic lights, warning signs. A red car can accidentally blend into that visual noise. Red also disappears faster in low-light conditions than most other colors, sitting at the low end of the visible light spectrum.
Will a Red Car Cost More to Insure?
No. This one’s a clean-cut myth.
Insurance companies don’t factor in vehicle color when calculating premiums. They use your Vehicle Identification Number (VIN), which encodes the make, model, engine, and body type — but not the exterior color.
What does raise your rates:
- Your driving record — One speeding ticket can raise your premiums by 37%
- Vehicle class — A performance car costs more to insure than a sedan
- Theft risk — Neutral-colored cars get stolen far more often than bright ones, since they blend in better
Ironically, a red car is less likely to get stolen than a white or black one, purely because it’s easier to spot in a parking lot or on the road.
The Bigger Picture: Who’s Really Getting Pulled Over?
Here’s where the conversation about what color cars get pulled over the most gets genuinely complicated.
While everyone debates paint jobs, comprehensive research points to a far more troubling pattern in traffic enforcement. The Stanford Open Policing Project analyzed nearly 100 million traffic stops across dozens of U.S. jurisdictions from 2011 to 2018.
The findings were stark. Black drivers are stopped 20–43% more often than white drivers relative to their share of the driving population. In Chicago, over 200 Black drivers per 1,000 residents were stopped, compared to just 50 white drivers per 1,000.
Even more revealing: researchers used a methodology called the Veil of Darkness test. It’s simple logic — if officers are racially profiling, they should stop fewer minority drivers at night when it’s harder to see the driver’s race. The data confirmed this. In Texas, about 25% of drivers stopped just before sunset were Black. After dark, that number dropped to about 20%.
The research also showed that Black and Hispanic drivers are searched at 1.4 to 2 times the rate of white drivers — even though those searches are less likely to find contraband.
The color of the car barely registers in that picture.
The Bottom Line on What Color Cars Get Pulled Over the Most
Here’s the quick summary:
- By raw volume: White cars get the most tickets — because there are more of them on the road than any other color
- By proportion: Red cars get ticketed more than their road presence justifies
- By actual cause: It’s about the driver, the vehicle type, and driving behavior — not the paint
- By systemic data: The driver’s race is a far more significant predictor of being stopped than any car color
So if you’re picking your next car based on what color cars get pulled over the most — relax. Choose the color you like. Keep your speed reasonable, put your phone down, and make sure your tail lights work. That’s the real formula for staying ticket-free, no matter what you’re driving.