
Picking a car colour feels like a personal choice. But research suggests your paint job might quietly affect your crash risk. This post breaks down which colours are genuinely dangerous, which are surprisingly safe, and what the data actually says. Stick around — the findings challenge a lot of common assumptions.
Black Cars Are the Riskiest on the Road
If you’ve ever wondered what colour cars have the most accidents, black is your answer — and it’s not even close.
Black cars absorb almost all light. Against dark asphalt, shadows, and fading twilight, they become nearly invisible to other drivers. The research backs this up hard:
- 12% higher crash risk than white cars during daylight hours
- Up to 47% higher crash risk during dawn and dusk conditions
That 47% figure is the one worth remembering. During twilight — when your eyes are transitioning between day and night vision — a black car on dark asphalt is essentially a ghost. Other drivers consistently misjudge its speed, distance, or miss it entirely.
Why Car Colour Actually Affects Crash Risk
Before diving deeper into the colour rankings, it helps to understand why colour matters at all.
Human eyes detect objects by reading contrast between the object and its background. A dark car on dark asphalt? Minimal contrast. The brain needs extra milliseconds to register it’s there. At highway speeds, those milliseconds translate to dozens of feet of travel distance — enough to eliminate the braking buffer entirely.
Conditions that make this worse:
- Dawn and dusk — your eyes struggle to process both colour and low-light contrast simultaneously
- Heavy fog or rain — ambient light scatters, shrinking your effective visual range dramatically
- Overcast skies — washes out contrast between vehicle and background
The Full Colour Risk Ranking
Here’s where each major colour sits on the risk spectrum, based on data from the Monash University Accident Research Centre — one of the most comprehensive crash studies ever conducted, covering over 850,000 police-reported accidents.
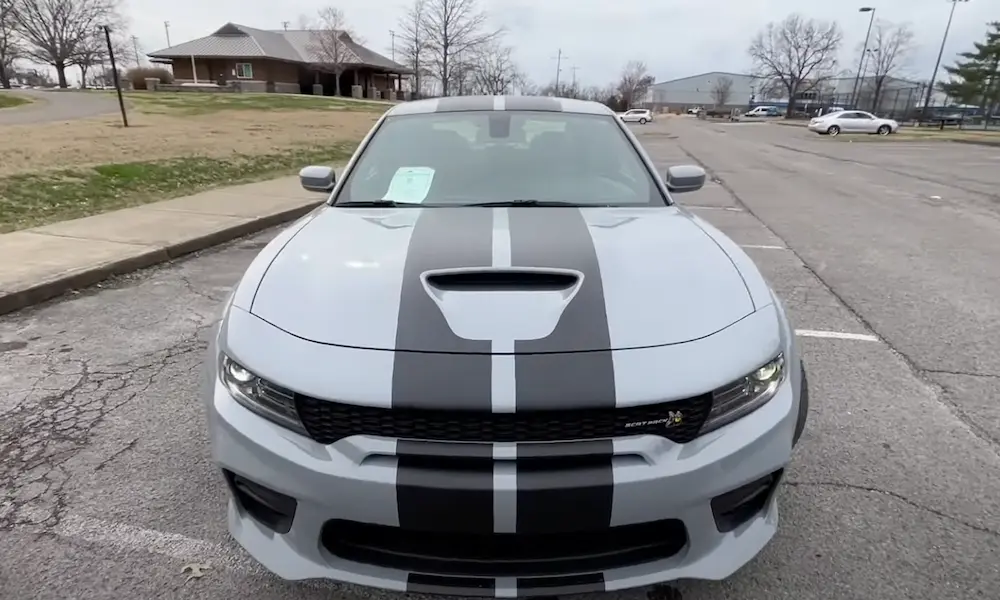
Grey and Silver: The Camouflage Problem
Grey cars carry an 11% higher crash risk than white. Silver sits at 10% higher. Their danger is sneaky — they mimic the exact colour of overcast skies, fog, rain, and aged asphalt. When weather turns bad, a grey car literally dissolves into its surroundings.
There’s one interesting contradiction worth mentioning. A New Zealand study published in the British Medical Journal found silver cars had a 50% lower serious injury risk than white. Researchers thought metallic silver’s reflective properties gave it a unique optical edge. However, the much larger Monash dataset largely refuted this finding. The broader consensus still places silver and grey in the higher-risk category — especially in bad weather.
Blue, Green, and Brown: Environmental Blending
These colours struggle because they match their surroundings too well.
- Blue carries roughly a 7% higher crash risk than white. Dark navy and midnight blue are worst — they blend into twilight skies and large bodies of water on open highways
- Green and brown show a significantly elevated risk in the multivariable crash analysis below, largely because they vanish into rural landscapes, trees, and grass
| Car Colour | Multivariable Odds Ratio vs. White |
|---|---|
| White | 1.0 (Baseline) |
| Blue | 0.9 |
| Red | 0.7 |
| Green | 1.8 |
| Black | 2.0 |
| Brown | 2.1 |
Brown carries the highest odds ratio in this dataset — even above black. If you’re driving through heavily wooded or rural areas, a brown car becomes almost invisible against the landscape.
Red: The Surprising Middle Ground
Red feels safe — it’s bold, bright, and biologically programmed to grab attention. Yet research puts red cars at roughly 7% higher crash risk than white.
Two reasons explain this:
Visual clutter. Urban roads are saturated with red — brake lights, traffic signals, stop signs, construction barriers, emergency vehicles. A red car chassis gets lost in that visual noise. Drivers experience tiny but consequential delays in distinguishing a moving red vehicle from the static red elements everywhere around it.
Driver behaviour. Some research suggests that drivers who choose red vehicles may exhibit slightly higher risk-taking tendencies. Observational studies also found that other motorists respond more aggressively around red cars — honking sooner, driving more reactively. That external aggression adds another crash variable.
The Safest Car Colours You Can Buy
White: The Gold Standard for Safety
White is the universal baseline in crash studies for good reason. It provides maximum contrast against almost every background — black asphalt, green foliage, grey urban concrete, and blue daytime skies.
The only condition where white loses its edge? Heavy snowfall or whiteout fog. But across the full range of weather conditions in a typical year, white consistently performs best. Insurance data reinforces this — white vehicles generate the lowest frequency of insurance claims.
Yellow and Orange: Technically the Safest of All
Biologically speaking, yellow may be the single safest colour you can put on a car. Here’s why: your retina’s peak sensitivity sits precisely in the yellow-green spectrum. Yellow triggers visual recognition faster than any other hue. That’s exactly why school buses, taxis, and highway maintenance vehicles are yellow — it’s not branding, it’s pure visibility science.
Orange shares the same advantage. Neither colour exists naturally in most urban or rural driving environments, so they stand out immediately against any background.
| Colour Category | Visibility Characteristics | Best Conditions |
|---|---|---|
| Yellow & Amber | Unmatched conspicuity, peak retinal sensitivity | Poor weather, fog, overcast skies |
| White | Maximum contrast across most environments | Year-round, all conditions except snow |
| Red & Orange | High visual impact in green environments | Daylight, rural settings |
| Grey & Silver | Blends into overcast skies and rain | Sunny days only |
| Black & Dark Navy | Near-zero contrast against road surfaces | Only in bright reflective snow conditions |
What U.S. Data Actually Shows (And What It Doesn’t)
Here’s where things get complicated. If you’re searching for official U.S. government data on what colour cars have the most accidents, the NHTSA doesn’t publish it. Not because they’re hiding it — because the data doesn’t exist in clean, usable form.
Crash reports across 50 states use completely different systems. One state codes “charcoal,” “slate,” and “metallic silver” as separate colours. The next lumps them all under “grey.” Police assess colour subjectively at chaotic crash scenes. The result is data that’s too fragmented for a reliable national analysis.
The NHTSA’s stance makes sense when you look at the bigger picture. Their research attributes 94% of all crashes to driver error — speeding, distraction, impairment. When you’re working with that figure, passive paint colour becomes a rounding error. Federal focus — and funding — goes toward behaviours that kill people at scale.
The Ohio Study That Challenges Everything
A University of Dayton study using Ohio crash data from 2011–2015 applied rigorous statistical modelling — specifically Negative Binomial regression — to isolate paint colour from every other variable.
The result? When you strip out driver age, gender, weather, and behavioural factors, no car colour in Ohio showed a statistically significant difference in crash risk compared to white.
This doesn’t mean black cars are suddenly safe. It means that in practice, on American roads, the overriding crash factors — distraction, speed, impairment — drown out the optical physics of paint colour. The danger is real. Whether it shows up cleanly in domestic data is a different question.
The Fleet Dominance Problem With U.S. Crash Stats
Raw state-level crash numbers mislead almost everyone who reads them. Take Pennsylvania — PennDOT data shows white cars involved in 21.6% of accidents, followed by black at 20.5%. Does that mean white is dangerous? No. It means white is everywhere.
White, black, grey, and silver account for over 70% of all new vehicles sold in the U.S. When those colours dominate the fleet, they dominate raw accident counts by default. Without adjusting for fleet density, the numbers are essentially useless for drawing safety conclusions.
The Myths Worth Debunking
Red cars get more speeding tickets. No empirical evidence supports this. AAA confirms car colour plays zero role in citation rates — the only variable that matters is your actual speed.
Bold colours raise insurance premiums. Insurance companies don’t factor in paint colour at all. Your premium comes from your driving history, location, vehicle make and model, and safety features. Your paint job is irrelevant.
Bright cars get stolen more. Actually, the opposite is true. Thieves specifically target neutral colours — black, white, silver, grey — because they blend into traffic. A bright yellow car is a liability for anyone trying to disappear. High-visibility colours inadvertently function as theft deterrents.
Does Colour Still Matter With Modern Safety Tech?
This is the most important question to ask right now. The honest answer: less than it used to.
Daytime Running Lights cut multi-vehicle daytime crashes by 3–5%. Slap bright LED DRLs on a black car and you’ve largely neutralised the optical danger of the dark paint. The light does the visibility work the paint can’t.
More significantly, radar and LiDAR-based systems — automatic emergency braking, blind-spot monitoring, lane-keeping assist — don’t care what colour your car is. A radar pulse bounces off metal geometry regardless of whether it’s painted black or yellow. As these systems become standard on every new vehicle, the biological limitations of human vision — the exact vulnerability that makes dark cars dangerous — get engineered out of the equation entirely.
Safety experts recommend prioritising vehicles with strong ADAS ratings over choosing a specific paint colour. The technology delivers measurably larger, verifiable safety gains than passive conspicuity ever will.
The Bottom Line on Car Colour and Crash Risk
The research is clear on the fundamentals: black is the highest-risk colour, white is the safest baseline, and yellow is technically the most visible of all. Grey, brown, and green carry meaningful elevated risks due to environmental blending. Red sits in an uncomfortable middle ground despite its apparent brightness.
But — and this matters — colour is a passive safety factor operating at the margins. Driver behaviour, active lighting systems, and modern collision avoidance technology dwarf its impact. If you’re buying a car purely for safety, your priority list should look like this:
- Strong ADAS suite (automatic emergency braking, blind-spot monitoring)
- High IIHS or NHTSA safety ratings
- Modern model year with updated lighting systems
- Then, if you’re choosing between otherwise equal options, pick white or yellow over black or grey
Colour is still worth thinking about. It’s just not the first thing worth thinking about.