
Choosing between Subaru and Toyota feels like picking between two legends. Both brands dominate reliability rankings, but they win in very different ways. This post breaks down the real numbers on Subaru vs Toyota reliability — from engine design to 10-year ownership costs — so you can pick the right car for your life. Stick around, because the answer might surprise you.
How the Two Brands Stack Up Right Now
In 2025, Subaru grabbed the #1 overall brand ranking from Consumer Reports — its second year in a row at the top. Toyota landed at #5 overall but reclaimed the top spot for predicted reliability specifically.
So what gives? Subaru scored higher on road tests, emergency handling, and safety integration. Toyota scored better on long-term dependability and repair costs.
Here’s the quick snapshot:
| Metric | Subaru | Toyota | Industry Average |
|---|---|---|---|
| Consumer Reports Overall Rank (2025) | #1 | #5 | N/A |
| Consumer Reports Reliability Score | 63/100 | 66/100 | N/A |
| RepairPal Reliability Rating | 3.5/5.0 | 4.0/5.0 | 3.5/5.0 |
| Annual Maintenance Cost | $617 | $441 | $652 |
| Probability of Severe Repair | 13% | 12% | 12% |
| Unscheduled Shop Visits (per year) | 0.30 | 0.30 | 0.40 |
Both brands visit the shop far less often than the average vehicle — that’s a win for Japanese engineering across the board. But Toyota’s lower annual cost and slightly higher reliability score tell a more nuanced story.
The Engine Battle: Boxer vs Inline
Subaru’s Boxer engine is one of the most distinctive designs in the mainstream car market. The horizontally opposed pistons cancel out engine vibrations naturally, giving you smoother operation and — in theory — less wear on internal components over time.
The low center of gravity also helps Subaru nail emergency handling scores that Toyota’s taller inline engines can’t always match.
But here’s the catch: the Boxer’s sideways layout makes routine maintenance a real headache. Spark plugs, valve cover gaskets, and even basic inspections require more disassembly than a standard Toyota inline-4.
What That Means for Your Wallet
| Service Task | Toyota Inline-4 Labor | Subaru Boxer Labor |
|---|---|---|
| Spark Plug Replacement | 1.0–2.0 hrs | 2.5–3.4 hrs |
| Valve Cover Gaskets | 2.0–3.0 hrs | 3.0–4.0 hrs |
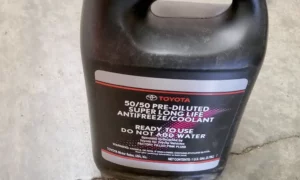
| Cooling System Flush | 1.0–1.5 hrs | 1.0–1.5 hrs |
| Oil Change | 0.5–0.75 hrs | 0.5–0.75 hrs |
Simple jobs stay simple on both cars. But mid-life engine services on a Subaru cost more in labor — almost every time.
One more thing worth knowing: Subaru’s old head gasket problem affected 2.5-liter engines from roughly 1999 to 2011. Modern Subarus built after 2012 use multi-layer steel gaskets, and that issue is largely gone. Toyota hasn’t had a systemic flaw of that scale, though its late-2000s models had oil consumption issues.
Transmission Reliability: CVTs, Hybrids, and the “$8,000 Problem”
This is where the Subaru vs Toyota reliability debate gets really interesting.
Subaru’s Lineartronic CVT
Subaru uses a chain-driven CVT across most of its lineup. Early versions (2010–2015) had problems. The current generation is much better, and Subaru even extended CVT warranties to 10 years or 100,000 miles on many models to back that up.
The key maintenance rule: change your CVT fluid every 60,000 miles. Skip that, and you’ll hear grinding and jerking way too soon.
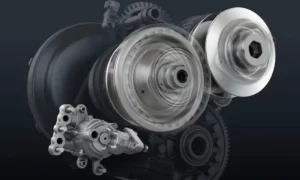
Toyota’s e-CVT and 8-Speed Automatic
Toyota’s hybrid e-CVT is genuinely remarkable. It’s a planetary gear system — no belts, no chains — and many Toyota hybrids have hit 400,000 miles in taxi service with the original transmission intact.
The traditional 8-speed automatic is a different story. Owners of 2020–2024 Highlanders have reported a transmission “whine of death” — a grinding noise caused by failed pinion shaft bearings. When those bearings go, they scatter metal debris through the transmission fluid and destroy the torque converter. Total repair cost: $8,000 to $9,700. Toyota issued TSB T-SB-0008-21 to address it, but over 278 complaints are already on record.
That’s a significant black mark against Toyota’s non-hybrid large SUV reliability.
| Transmission | Brand/Model | Reliability Trend | Main Risk |
|---|---|---|---|
| Lineartronic CVT | Subaru (General) | Improving; warranty extended | Solenoid failure, fluid degradation |
| e-CVT (Hybrid) | Toyota (Hybrid) | Excellent; industry-leading | Software glitches, heat management |
| 8-Speed Automatic | Toyota Highlander | Significant concerns; 278+ complaints | Pinion shaft bearings, torque converter |
| 6-Speed Automatic | Toyota (Older) | Highly reliable | Routine fluid oxidation |
Bottom line: if you’re buying a Toyota, seriously consider the hybrid drivetrain. It’s the most reliable transmission option either brand offers.
10-Year Ownership Costs: The Real Price of Reliability
This is where Toyota builds a clear financial lead in the Subaru vs Toyota reliability conversation.
According to CarEdge data, Toyota’s 10-year ownership cost runs about $1,821 less than Subaru’s on a like-for-like comparison. That gap grows because Subaru’s standard all-wheel drive requires extra services — differential fluid changes, transfer case services — every 30,000 to 60,000 miles.
| Year | Toyota Major Repair Probability | Subaru Major Repair Probability | Toyota Annual Cost | Subaru Annual Cost |
|---|---|---|---|---|
| Year 1 | 1.48% | 2.18% | $253 | $307 |
| Year 3 | 2.76% | 4.05% | $346 | $424 |
| Year 5 | 7.00% | 10.29% | $504 | $614 |
| Year 7 | 8.49% | 12.48% | $709 | $865 |
| Year 10 | 14.97% | 22.01% | $795 | $1,059 |
| 10-Year Total | $5,470 | $7,291 |
Model-by-Model Breakdown
| Segment | Toyota Model | 10-Year Cost | Subaru Model | 10-Year Cost |
|---|---|---|---|---|
| Compact SUV | RAV4 | $6,004 | Forester | $8,609 |
| Midsize SUV | Highlander | $6,224 | Outback | $8,800 |
| Compact Car | Corolla | $4,434 | Impreza | $6,343 |
| Midsize Sedan | Camry | $4,580 | Legacy | $6,485 |
Toyota holds the #2 spot on CarEdge’s “Least Expensive Brands to Maintain” list. The Prius and Corolla Hybrid rank among the cheapest vehicles to maintain over a decade — largely because regenerative braking reduces brake wear, and fewer mechanical components means fewer things to break.
Longevity: Who Actually Hits 250,000 Miles?
If you’re buying a car to keep forever, this section matters most.
iSeeCars analyzed over 174 million vehicles and found Toyota dominates extreme longevity — it’s not even close.
| Brand | Chance of Reaching 250,000+ Miles | vs. Industry Average |
|---|---|---|
| Toyota | 17.8% | 3.7x average |
| Lexus (Toyota) | 12.8% | 2.7x average |
| Honda | 10.8% | 2.3x average |
| Subaru | 2.3% | 0.5x average |
| Industry Average | 4.8% | 1.0x |
Subaru actually falls below the industry average for reaching 250,000 miles. That’s a tough number to ignore. Toyota’s Tundra and Sequoia each have over a 36% chance of hitting that milestone. The Subaru Outback — Subaru’s strongest performer — tops out around 208,298 miles in longevity projections.
If 15+ years of ownership is your goal, Toyota is the stronger bet.
Forester vs RAV4 and Outback vs Highlander: Real-World Comparisons
Forester vs RAV4
The Forester ranks 21st out of 26 compact SUVs on RepairPal with a 3.5/5.0 rating and $632 annual repair cost. The RAV4 ranks 3rd out of 26 with a 4.0/5.0 rating and $429 annual cost.
Consumer Reports gives the Forester higher road-test scores and better emergency handling. But the RAV4 — especially the RAV4 Hybrid — beats it on long-term cost and powertrain reliability.
Outback vs Highlander
The Outback ranks 10th out of 26 midsize SUVs with strong safety scores and all-weather capability. Its main weaknesses are minor electrical gremlins and occasional infotainment freezing.
The Highlander carries a higher resale value (58.21% vs 50.27% for the Ascent) but has faced serious transmission problems and a string of recent recalls covering everything from panoramic monitor software to seat belt anchors.
Safety Tech: EyeSight vs Toyota Safety Sense
Both systems work well, but they have different strengths and weaknesses.
Subaru EyeSight uses dual cameras mounted at the top of the windshield. It delivers excellent depth perception for emergency braking and adaptive cruise control. The downside? Those cameras are sensitive. A chipped windshield can require a full recalibration costing several hundred dollars. Heavy rain, thick fog, or strong sunlight can also temporarily disable the system.
Toyota Safety Sense pairs a camera with a radar sensor. That radar element makes it more resilient in bad weather than EyeSight’s camera-only setup. However, Toyota EV and hybrid owners have reported software-related dashboard warnings and instrument panel failures — serious enough to trigger a recall covering 2023–2025 models.
Neither system is perfect. EyeSight is more physically fragile; Toyota Safety Sense is more software-prone.
Warranty Coverage: Where They’re the Same and Where They Differ
| Warranty Type | Toyota | Subaru |
|---|---|---|
| Basic (Limited) | 3 yrs / 36,000 miles | 3 yrs / 36,000 miles |
| Powertrain | 5 yrs / 60,000 miles | 5 yrs / 60,000 miles |
| Hybrid Battery | 10 yrs / 150,000 miles | 8 yrs / 100,000 miles |
| Rust-Through | 5 yrs / Unlimited | 5 yrs / Unlimited |
| Free Maintenance | 2 yrs / 25,000 miles (ToyotaCare) | Generally none |
Toyota’s hybrid battery warranty is a significant advantage — 150,000 miles vs Subaru’s 100,000 miles. And ToyotaCare’s two years of free scheduled maintenance saves real money in the early ownership period.
Subaru fights back with its Added Security extended warranty, which can extend coverage up to 10 years or 120,000 miles on CPO vehicles. The Gold Plus plan covers nearly every mechanical and electronic component — including EyeSight and Starlink systems — plus up to $500 in lodging and meals if you break down more than 50 miles from home.
Which Brand Wins Based on Where You Live?
Geography matters more than most people realize when comparing Subaru vs Toyota reliability.
Northeast and Mountain states: Subaru’s Symmetrical All-Wheel Drive is always on — it’s built into the car’s design, not bolted on as an option. That means better balance, more consistent traction, and components designed to handle continuous load. Add standard ground clearance of 8.7 inches (the Outback Wilderness hits 9.5 inches) and you have a car built for snow country.
Sunbelt states: Toyota’s simpler front-wheel-drive models have fewer components exposed to heat stress. The inline-4 engine also allows better airflow through the engine compartment — helpful when you’re sitting in 110°F Phoenix traffic. Toyota’s cooling systems are well-regarded for desert climates.
The Future: Solterra, bZ4X, and the Hybrid Shift
The most interesting development in the Subaru vs Toyota reliability story is their joint electric vehicle platform. The Subaru Solterra and Toyota bZ4X are mechanically identical — built together. Ten-year projected costs favor Toyota ($3,479 for the bZ4X vs $4,811 for the Solterra), likely due to Toyota’s larger dealer network and different labor rates.
The 2025 Forester Hybrid uses Toyota’s proven hybrid system — which tells you everything about how much both brands trust that technology. Consumer Reports data shows hybrids currently have 15% fewer problems than traditional gasoline vehicles, and far fewer than plug-in hybrids or full EVs.
As Subaru adopts more of Toyota’s hybrid hardware, the reliability gap between the two brands is likely to narrow further.
So Which Brand Should You Pick?
Choose Toyota if:
- You plan to own the car for 15+ years
- You want the lowest possible 10-year maintenance costs ($5,470 vs $7,291)
- You drive mostly on highways or in warm climates
- You want the best hybrid battery warranty (10 yrs / 150,000 miles)
- You care about reaching 250,000 miles
Choose Subaru if:
- You live in snow country or drive off-road regularly
- You want the most standard safety features at every trim level
- You prioritize emergency handling and active safety tech
- You value the Added Security extended warranty protection
- A $1,800 higher long-term cost is worth the all-weather capability
Toyota has the higher ceiling for longevity. Subaru has the stronger floor for year-round capability and standard safety. Both brands sit far above the industry average on every meaningful reliability metric — and honestly, you can’t go wrong with either one.